The term “water footprint” is used to indicate the amount of fresh water that any given process or activity uses. Growing and processing crops and livestock consumes large quantities of water; therefore, the water footprint of food is high. Animal products, especially, like meat, dairy and eggs (all of which tend to require more water than fruits, vegetables and beans) have an even higher water footprint. Individually speaking, one’s diet makes up the largest part of one’s personal water footprint. This is why preventing food waste individually matters: because discarded food not only wastes the water that went into producing it, but all other resources involved, as well.
Three Components of Water Footprints
Water footprints were developed by the Water Footprint Network to assess the amount of water (in different types) that is consumed in producing food and other products. Water footprints are composed of three separate calculations: 1
- Blue Water Footprint: The amount of surface water and groundwater required (evaporated or used directly) to produce an item. For food, this refers mainly to crop irrigation.
- Green Water Footprint: The amount of rainwater required (evaporated or used directly) to make an item. For food, this refers to dry farming where crops receive only rainwater.
- Grey Water Footprint: The amount of fresh water required to dilute pollutants and make water pure enough to meet EPA water quality standards. For food, the water would have become polluted from agricultural runoff or leaching from the soil.
Water, Food and Agriculture
In the United States, agriculture is responsible for 80 percent of all water consumed (through evaporation or other means that remove it from a watershed). 2 It takes a surprising amount of water to grow and process food, because crops cannot grow without water, especially not without irrigation water. In fact, one’s diet accounts for more than two thirds of one’s own total water footprint, mostly because of all the “virtual water” needed to produce one’s food. Virtual water is the “hidden” component in a production process, which contributes to the total water footprint.
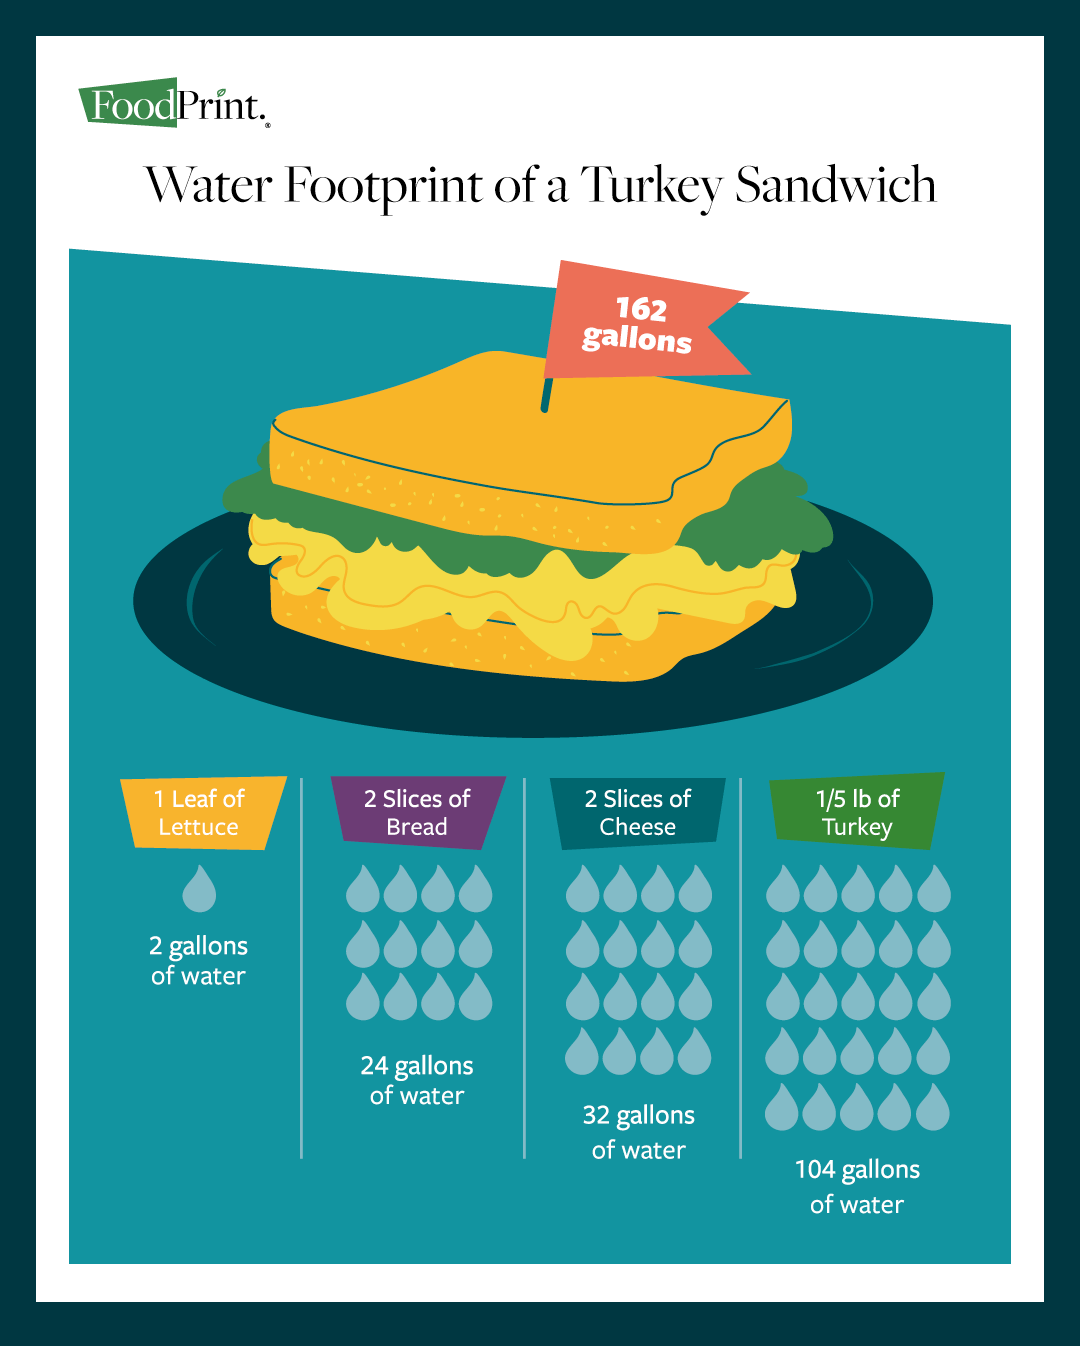
A typical lunch-time meal reveals how quickly virtual water adds up, according to data from the Water Footprint Network. 3 One loaf of bread takes about 240 gallons of water to produce, while one pound of cheese takes about 382 gallons. A simple cheese sandwich adds up to about 56 gallons of water. Add some sliced turkey, and the water footprint jumps to 148 gallons. Throw in a small bag of potato chips at 12 gallons and you’re up to 160. Include an ice-cold soda at 46, and this typical lunch took 206 gallons of water to produce.
The Water Footprint of Beef and Other Meat
Pound for pound, meat has a much higher water footprint than vegetables, grains or beans. 4 A single pound of beef takes, on average, 1,800 gallons of water to produce. Ninety-eight percent goes to watering the grass, forage and feed that cattle consume over their lifetime. 5 Where cattle diet consists mainly of grain-based feed, such as in industrial livestock production, the blue water footprint is high; where their diet consists mainly of grass and forage, the green water footprint is high.
Industrial Beef vs. Pastured Beef
In the United States, at least 80 percent of beef cattle are “conventionally” raised, meaning that they typically spend six months grazing on pasture, then they go to a feedlot for four to six months where they eat feed made from corn, soy and other grains. 6 While this type of diet speeds up the cattle’s growth — a beef steer or heifer can eat 1,000 pounds or more of feed over a few months — it is not without costs. 7 With nearly 29 million head of beef cattle produced in the US (as of 2012), grain is consumed in vast amounts. 8
Raising thousands of cattle on confining feedlots has ecological consequences. 9 First, there is increased land use to grow the grain required. Also, all those animals collectively generate enormous piles of waste, which must be managed and which often end up polluting waterways. Much of the grain that cattle eat is from irrigated crops. For example, in 2012, corn production accounted for roughly 25 percent of total US-irrigated acreage harvested, 10 while hay and other forage production made up 18 percent. In addition, most irrigated acreage is located in the American plains and western states – regions that experience frequent droughts and water scarcity, placing additional burdens on already stressed water supplies. All of this figures into the water footprint of conventional beef. 11
Pasture-raised cattle, by comparison, spend their entire life eating grass. They typically take 24 to 28 months to reach market weight, because it takes longer for them to gain weight. 12 Because they rely on grass that is predominantly rain-fed, grass-fed cattle have a higher green water footprint, which isn’t a problem unless there is a drought that impacts availability of grass. In addition, manure from grass-fed cattle production is typically used as land fertilizer and is part of regenerative agricultural practices in well-managed pasture operations.
The US and Global Water Footprint of Beef
Given that the average American eats around 181 pounds of meat annually, it is easy to see how meat consumption might account for so much of an American’s water footprint. 13 In fact, American meat consumption is nearly three times that of the global average. 14 Worldwide consumption of meat and animal products makes up 27 percent of humanity’s total water footprint. 15 Of that total, 98 percent is due to the water required to produce animal feed, while water for drinking, cleaning and feed mixing constitutes only 1.1 percent, 0.8 percent and 0.03 percent, respectively. 16
How and Where Food Comes from Impacts a Person’s Water Footprint
Diets made up of highly processed foods — like packaged snacks and ready-made meals – also use a lot of water. 17 For example, ounce for ounce, potato chips have a higher water footprint than whole potatoes. 18 After growing the potatoes (which uses the most water), it takes more water to clean the potatoes and the processing machinery, plus even more water for producing cooking oil for deep frying, producing fuel for delivery and packaging the product. This quantity of water — that incorporates growing, processing, cooking, packaging and transport — is known as “virtual water.”
Where food is grown can also impact a person’s water footprint. California, for example, produces more food than any other US state, supplying a large part of the country’s milk, beef, produce and nuts. 1920 It is also one of the nation’s driest states and recently experienced a drought of historic proportions. As a result, California’s agricultural sector puts enormous strain on the water supplies of the entire southwest, mainly through its allotments from the Colorado River, which it shares with other states. A significant portion of that limited water supply is then “shipped” as virtual water when they export almonds or alfalfa (for animal feed) to other states or countries, like Japan and China. 2122 Likewise, when food is shipped from other states and countries, it taps into distant water supplies. As global trade increases the amount of food that is moved around the planet, these calculations become important indicators of the actual amount of water used to get these foods to peoples’ plates.
Transporting food over long distances also requires large quantities of fuel, which pollutes the air, contributes to climate change and uses huge volumes of water. Producing gasoline and other transportation fuels requires water: about 3/4 gallon of water is needed to produce enough gasoline to drive one mile. 23
In short, agriculture has a significant impact on water resources; and while people’s individual water footprints will never approach zero, the more meat, dairy and processed foods each of us consumes, the more water we use and the higher our water footprints. That is why it is important to understand how the various components of water footprints for a particular food item are calculated.
What You Can Do
- Use the Water Footprint Calculator to find out how your diet affects your personal water footprint.
- Check out the Water Footprint of Food Guide to learn your food’s water footprint.
- Find ways to stop wasting food and remember that discarded food wastes all the resources it took to produce that food, including water.
- Choose pasture-raised animal products when you can. Use our Labels Guide to help choose the best animal products for you and your family.
- Reduce the amount of processed food in your diet.
Hide References
- Water Footprint Network. “Product gallery.” Water Footprint Network, 2017. Retrieved May 31, 2018, from https://waterfootprint.org/en/resources/interactive-tools/product-gallery/
- US Economic Research Service. “Irrigation & Water Use.” United States Department of Agriculture, (n.d.) Retrieved May 31, 2018 from https://www.ers.usda.gov/topics/farm-practices-management/irrigation-water-use.aspx
- Water Footprint Network. “Product gallery.” Water Footprint Network, 2017. Retrieved May 31, 2018, from https://waterfootprint.org/en/resources/interactive-tools/product-gallery/
- Water Footprint Network. “Water footprint of crop and animal products: a comparison.” Water Footprint Network, 2011. Retrieved May 31, 2018, from
- Ibid.
- Matthews, Kenneth and Johnson, Rachel. “Alternative Beef Production Systems: Issues and Implications.” United States Department of Agriculture, April 2013. Retrieved May 31, 2018, from https://usda.mannlib.cornell.edu/usda/ers/LDP-M/2010s/2013/LDP-M-04-04-2013.pdf
- US Economic Research Service. “Cattle & Beef: Sector at a Glance.” United States Department of Agriculture, May 7, 2018. Retrieved May 31, 2018, from https://www.ers.usda.gov/topics/animal-products/cattle-beef/background.aspx
- National Agricultural Statistics Service. “Cattle and Calves Inventory: 2012 and 2007.” United States Department of Agriculture, 2012. Retrieved May 31, 2018, from https://agcensus.usda.gov/Publications/2012/Full_Report/Volume_1,_Chapter_1_US/st99_1_012_013.pdf
- Food and Water Watch. “Ban Factory Farms.” FWW, (n.d.) Retrieved May 31, 2018, from https://www.foodandwaterwatch.org/campaign/ban-factory-farms
- US Economic Research Service. “Irrigation & Water Use.” United States Department of Agriculture, (n.d.) Retrieved May 31, 2018, from https://www.ers.usda.gov/topics/farm-practices-management/irrigation-water-use.aspx
- US Economic Research Service. “Irrigation & Water Use.” United States Department of Agriculture, (n.d.) Retrieved May 31, 2018, from https://www.ers.usda.gov/topics/farm-practices-management/irrigation-water-use.aspx
- Stone Barns Center for Food and Agriculture. “Back to Grass: The Market Potential for U.S. Grassfed Beef.” Stone Barns Center for Food and Agriculture, (n.d.) Retrieved May 31, 2018, from https://www.stonebarnscenter.org/wp-content/uploads/2017/10/Grassfed_Full_v2.pdf
- Bentley, Jeanine. “U.S. Per Capita Availability of Red Meat, Poultry and Fish Lowest Since 1983.” United States Department of Agriculture, February 6, 2017. Retrieved May 31, 2018, from https://www.ers.usda.gov/amber-waves/2017/januaryfebruary/us-per-capita-availability-of-red-meat-poultry-and-fish-lowest-since-1983/
- Organisation for Economic Co-operation and Development. “Meat consumption.” OECD, 2016. Retrieved May 31, 2018, from https://data.oecd.org/agroutput/meat-consumption.htm
- Hoekstra, Arjen Y. “The hidden water resource use behind meat and dairy.” Twente Water Centre, 2014. Retrieved May 31, 2018, from https://waterfootprint.org/media/downloads/Hoekstra-2012-Water-Meat-Dairy.pdf
- Mekonnen, MM and Hoekstra, AY. “The Green, Blue and Grey Water Footprint of Farm Animals and Animal Products, Volume 1: Main Report.” Table 6, No.48. UNESCO-IHE, p. 29, Table 6. No.48. Retrieved May 31, 2018, from https://waterfootprint.org/media/downloads/Report-48-WaterFootprint-AnimalProducts-Vol1_1.pdf
- Chapagain, Ashoak and James, Keith. “The water and carbon footprint of household food and drink waste in the UK.” World Wildlife Fund, March 2011. Retrieved May 31, 2018, from https://waterfootprint.org/media/downloads/Water-and-carbon-footprint-food-and-drink-waste-UK-2011_1.pdf
- Water Footprint Network. “Product gallery.” Water Footprint Network, 2017. Retrieved May 31, 2018, from https://waterfootprint.org/en/resources/interactive-tools/product-gallery/
- California State Assembly. “Fast Facts on California’s Agricultural Economy.” California State Assembly, 2014. Retrieved from https://ajed.assembly.ca.gov/sites/ajed.assembly.ca.gov/files/Fast%20Facts%20on%20California’s%20Agricultural%20Economy.pdf
- Palmer, Brian. “The C-Free Diet.” Slate, July 10, 2013. Retrieved May 31, 2018, from https://www.slate.com/articles/health_and_science/explainer/2013/07/california_grows_all_of_our_fruits_and_vegetables_what_would_we_eat_without.html
- Pierson, David. “U.S. farmers making hay with alfalfa exports to China.” Los Angeles Times, June 8, 2014. Retrieved May 31, 2018, from https://www.latimes.com/business/la-fi-feeding-china-hay-20140609-story.html
- Associated Press. “How China’s taste for almonds is sucking drought-stricken California dry.” South China Morning Post, April 20, 2015. Retrieved May 31, 2018, from https://www.scmp.com/news/world/article/1771871/how-chinas-taste-almonds-sucking-drought-stricken-california-dry
- King, Carey W. and Webber, Michael E. “Water Intensity of Transportation.” Environmental Science & Technology, 42(21), pp 7866-7872 (2008). Retrieved May 31, 2018, from https://pubs.acs.org/doi/full/10.1021/es800367m